Slow, self-limiting processes can be very time-consuming and difficult to tune. However, a self-limiting process with a high lag/deadtime ratio looks a lot like an integrating process. Can we tune these processes as if they are integrating processes, treating them like near-integrating processes? Yes, we can.
Near integrating process controller tuning insights
- Slow self-limiting processes with high lag/deadtime ratios (aka near-integrating processes) can be tuned using open loop integrating process tuning methods. This can reduce loop tuning time up to 90%.
- The open loop tuning method for near integrating processes is nearly identical to the method for integrating processes. The one difference for near integrators is the process must be at steady state before starting the test.
- The (pseudo) fill time to deadtime ratio must be checked to verify the calculated tuning constants will be stable.
- The calculated tuning constants may not be ideal and require further modification to achieve best response.
How can we use integrating process open loop tuning methods to tune certain self-limiting processes, so called near-integrating processes?
What is a near-integrating process?
A near integrating process is a self-limiting process with a high lag/deadtime ratio. Processes with a high lag/deadtime ratio are often very slow. Lag times can be many minutes or hours. These are difficult to tune using self-limiting process open loop tuning methods. It takes a lot of time for the process to come to steady state after a step test, and there is a high likelihood that a process disturbance will ruin the step test. Getting good step test results is time-consuming and prone to error, therefore there is a strong incentive to develop a faster method.
This is where using integrating process open loop tuning comes in handy. A slow, high lag/deadtime ratio self-limiting process looks a lot like an integrating process in the short term. We only need to run the step test long enough to get the initial slope of the process response, which can shorten step testing time up to 90%.
There are some caveats. Since we don’t determine a process gain or process lag, the tuning constants we calculate can be poor estimates, which is why we have heuristic methods to trim up the tuning. However, the increase in speed at getting results can be a good tradeoff. This process only works on high lag/deadtime ratio processes. High lag/deadtime ratio processes are stable even if the controller gain is five, 10 or more times the baseline controller gain (the inverse of the process gain). Since we don’t know the process gain, we cannot know what the controller gain stability limit might be. Therefore, we should only use this on a process where it is unlikely we will cause instability.
Open loop tuning method for near-integrating processes
The open loop controller tuning method is done with the controller in manual mode. This is when a controller is in manual it is operating in open loop.
The method is:
- Place the controller in manual.
- Step the controller output (OP) up or down 2 to 10%.
- From trends estimate the:
o Change in OP (ΔOP – %).
o Slope of the process variable (PV) after the change (ΔPV/time – %/minute).
o Apparent deadtime (Dt – minutes).
- Calculate the tuning constants using your favorite calculations.
We are assuming the effect of any process lags can be ignored. We are only interested in the effective deadtime that any lags create.
The instructions are like open loop tuning of an integrator. The one difference is the PV slope before stepping the OP is zero; the process is at steady state. If you believe that another step is necessary, you should wait until the process has come to steady state.
What an open loop step test looks like
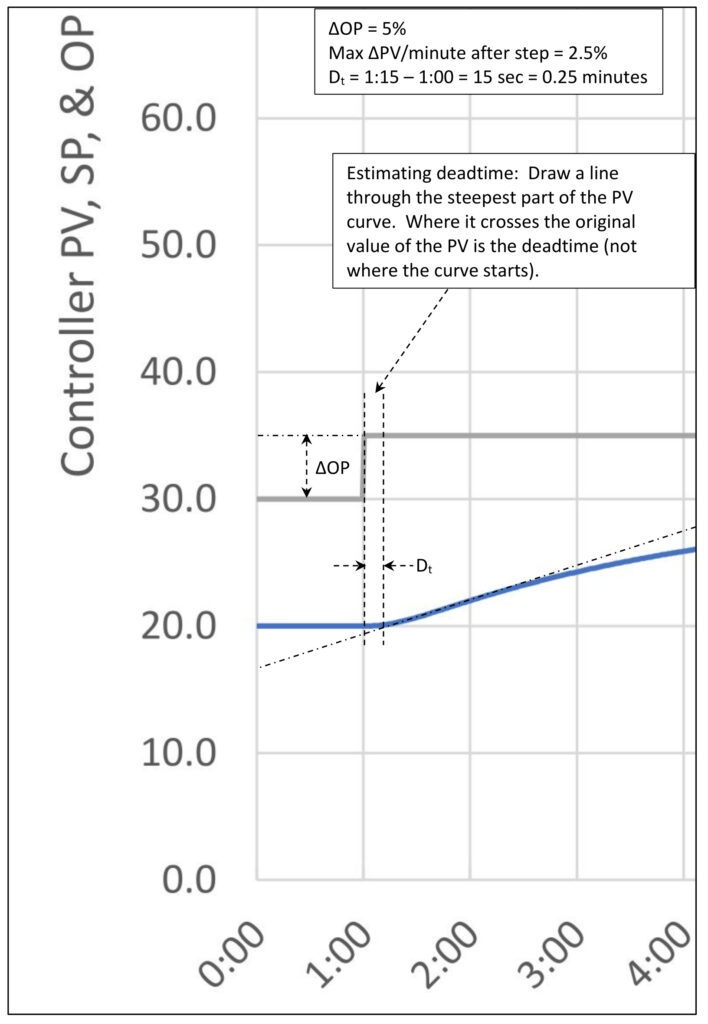
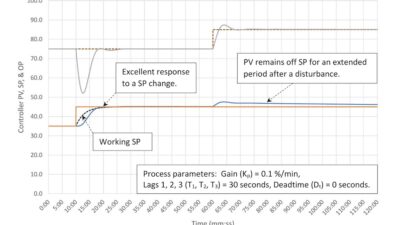
Figure 1 shows an open loop step test of a self-limiting process with a process gain (Kp) of 2, two lags of 10 seconds, one lag of 180 seconds and no deadtime. This has a high lag/deadtime ratio and therefore can be treated as a near integrating process. We are only looking at the first three minutes of the step test because that is all we need to gather the information required for our calculations.
The near integrating process open loop tuning method uses this procedure.
Step 1: Place the controller in manual.
Step 2: Verify the process variable (PV) is moving in a straight line.
Step 3: Step the controller output (OP).
Step 4: Estimate the change in PV slope and deadtime from the process reaction curve (read them off the trend).
Step 5: Write down the ΔOP, the maximum ΔPV/minute rate and the deadtime (Dt):
- ΔOP = 5%
- Max ΔPV/min = 2.5%/min
- Dt = 0.25 minutes
Step 6: Calculate the near integrator process gain (Kp):
Kp = Max ΔPV/min / ΔOP
Kp = 2.5 / 5
Kp = 0.5%/min
From here we can calculate a pseudo fill time (Tfill):
Tfill = 1/Kp
Tfill = 1/0.5
Tfill = 2 minutes/%
Step 7: Calculate and test.
Calculating tuning constants
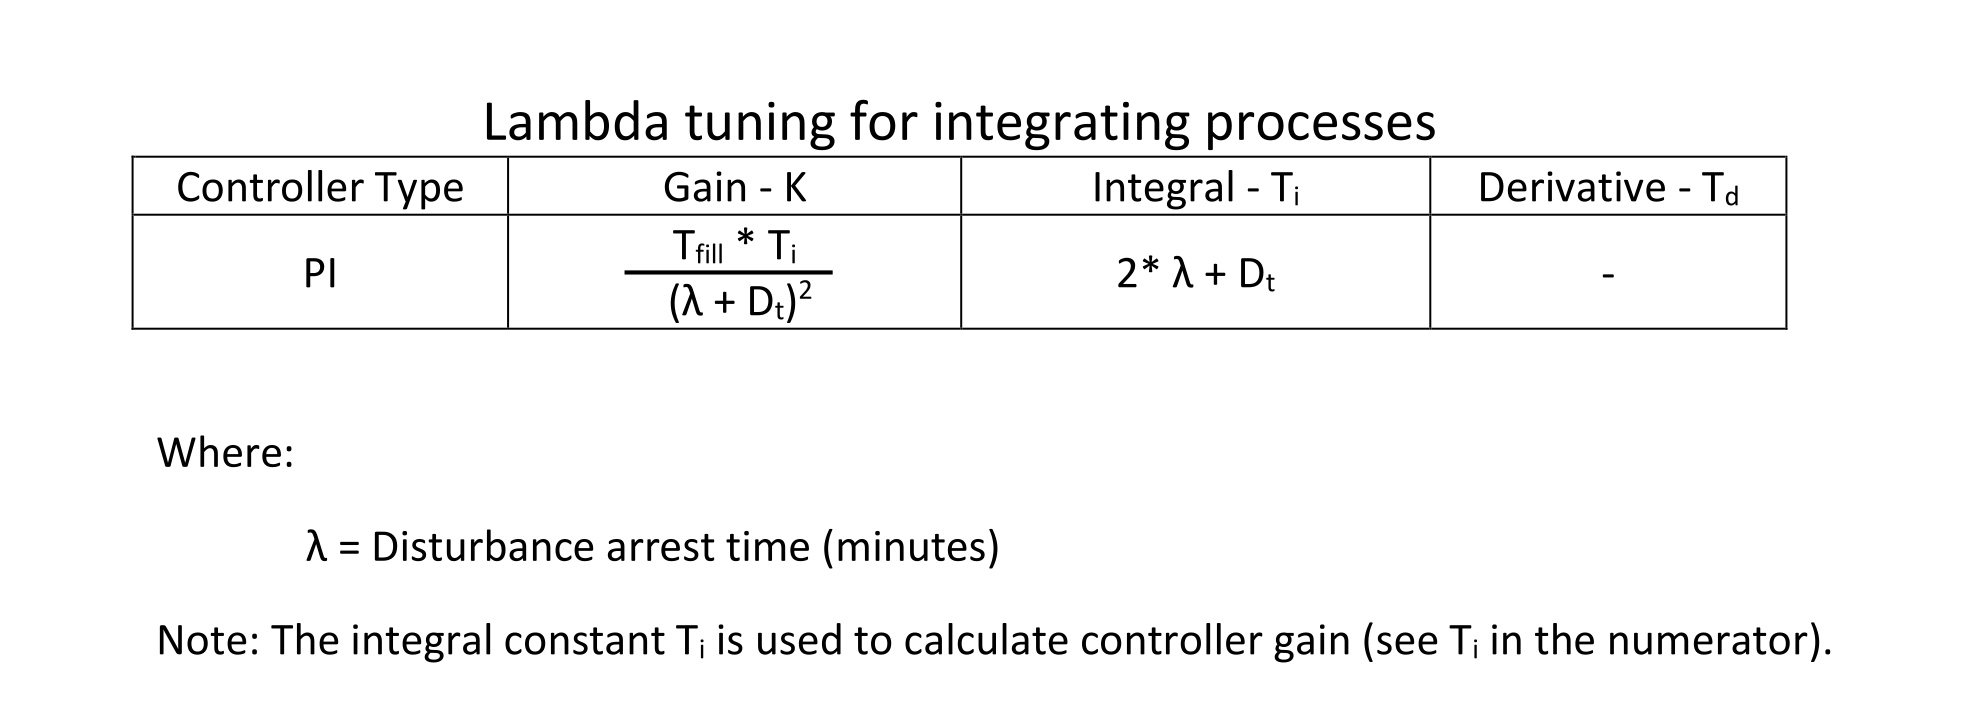
A concept critical to several loop tuning methods is arrest time (λ). Those of you who have worked with lambda tuning will recognize the Greek letter λ. Lambda is used in multiple tuning methods to allow controller response to be customized. With integrating processes, lambda is the time to stop a process upset (in the time scale the control system uses for tuning, which for us is minutes). Table 1 contains the lambda tuning rules for integrating processes.
Table 1 – Lambda Tuning for Integrating Processes
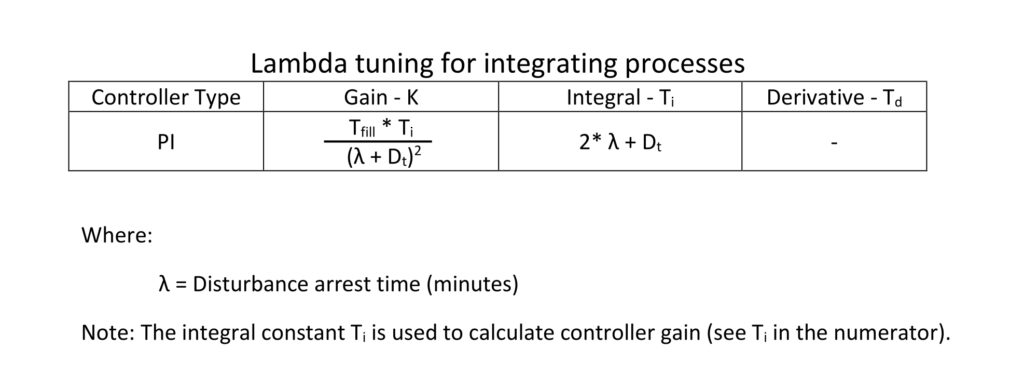
Key to using any of these tuning methods is understanding the limitations on λ. You can’t arrest the effects of a process disturbance faster than the process deadtime or for some time after the deadtime has passed. Therefore, there is a limitation on λ:
λ >= 3 * Dt
You may choose to go higher but setting λ lower risks controller instability.
The self-limiting process gain (Kp) isn’t used to calculate the tuning constants. The implicit assumption is that lag dominant processes can accommodate a controller gain higher than any we will calculate using this method.
Validating the calculation method
Since we step tested a process with a pseudo fill time of 2.0 minutes/% and an apparent deadtime of 0.25 minutes, let’s see how the calculations turn out. The minimum permitted λ is:
λ = 3 * 0.25
λ = 0.75
This is the most aggressive setting. We should expect the tuning to minimize the disturbance arrest time but at the cost of a strong response to setpoint changes, oscillation and potential instability.
The calculated tuning constants are shown in Table 2:
Table 2 – Aggressive Lambda Tuning of Near Integrating Process

Another thing we should do is calculate the fill time/deadtime ratio to verify that we should not expect stability issues. In this case the ratio is:
Tfill/Dt = 2.0 / 0.25
Tfill/Dt = 8.0
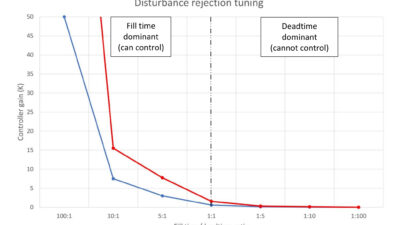
From PID spotlight part 13, in Figure 1 it looks like the process will be stable with a controller gain up to about 10. The controller gain for disturbance rejection tuning will be in the vicinity of 5. Therefore, we shouldn’t expect any stability issues with a controller gain of 3.5.
We would be remiss if we didn’t estimate the time savings we achieved by treating this as a near-integrating process. The step test in Figure 1 yielded all the information we needed in about two minutes. The time for an open loop step test to come to steady state is nominally four times the dominant lag, which in this case is three minutes (T1 = 180 seconds). It would have required a minimum of 12 minutes to estimate the process gain. We saved at least 10 minutes or about 85% of the time to perform a full open loop step test.
The only question remaining is: Do these tuning constants work?
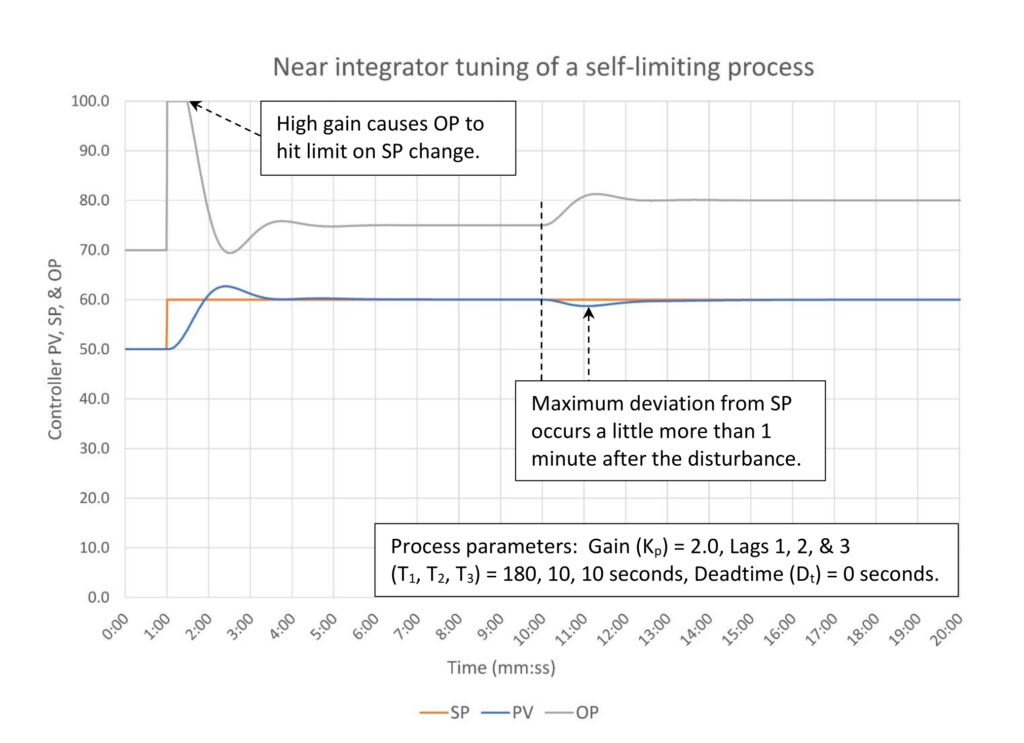
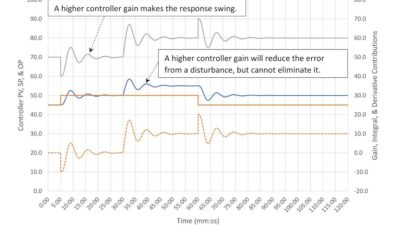
In figure 2 we see that the controller tuning is aggressive but stable. Not surprisingly a controller gain of 3.5 causes the controller output (OP) to hit 100% on a setpoint (SP) change. The remainder of the response to the setpoint change is oscillatory. The response to a load disturbance is very quick. It appears the ‘arrest time’ is a little more than 0.75 minutes after the deadtime has passed, which is the chosen value of λ.
The method looks like it works reasonably well even though we do not have a process gain or lag time constant to work with. This looks close to disturbance rejection tuning. If we were looking for critically damped tuning, we would use heuristics to estimate new tuning constants.
For comparison, let’s calculate tuning constants using the simplified IMC calculations for self-limiting processes used in PID spotlight part 7. Table 3 is a copy of the calculations from PID spotlight part 7 for a PI controller.
Table 3 – Simplified IMC Tuning Calculations

We know that the process gain Kp is 2.0, therefore the baseline controller gain Kbase = 0.5 and the dominant process lag T1 = 3 minutes. When we include the apparent deadtime from the step test we have all the information necessary to calculate simplified IMC tuning constants:
Table 4 – Simplified IMC Tuning of Self-Limiting Process

The simplified IMC controller tuning constants for this process are:
K = 1.53
Ti = 2.44
For comparison purposes the “near integrating” tuning constants are:
K = 3.5
Ti = 1.75
The new constants are less aggressive, so we should expect to see a less aggressive response.
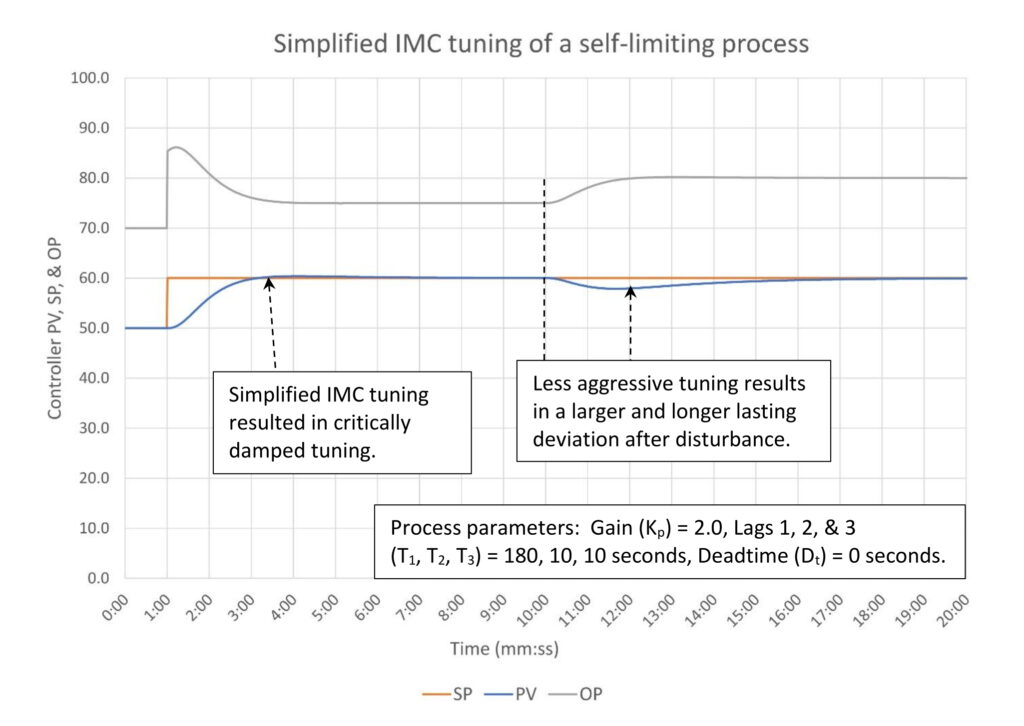
Figure 3 shows that simplified IMC tuning does result in critically damped response to a setpoint change as it should. This is considerably less aggressive than the lambda tuning displayed in Figure 2, which was intentionally as aggressive as possible. From here we can start to see the value of lambda tuning and other similar tuning methods that allow us to dial-a-response. If we pick a larger value for λ we should expect the controller response to become less aggressive. For example, if we would like the controller output to avoid large changes on a setpoint change we could set λ to two minutes. The tradeoff here is a longer disturbance arrest time (two minutes) for less controller output movement.
Table 5 – Relaxed Lambda Tuning of Near Integrating Process

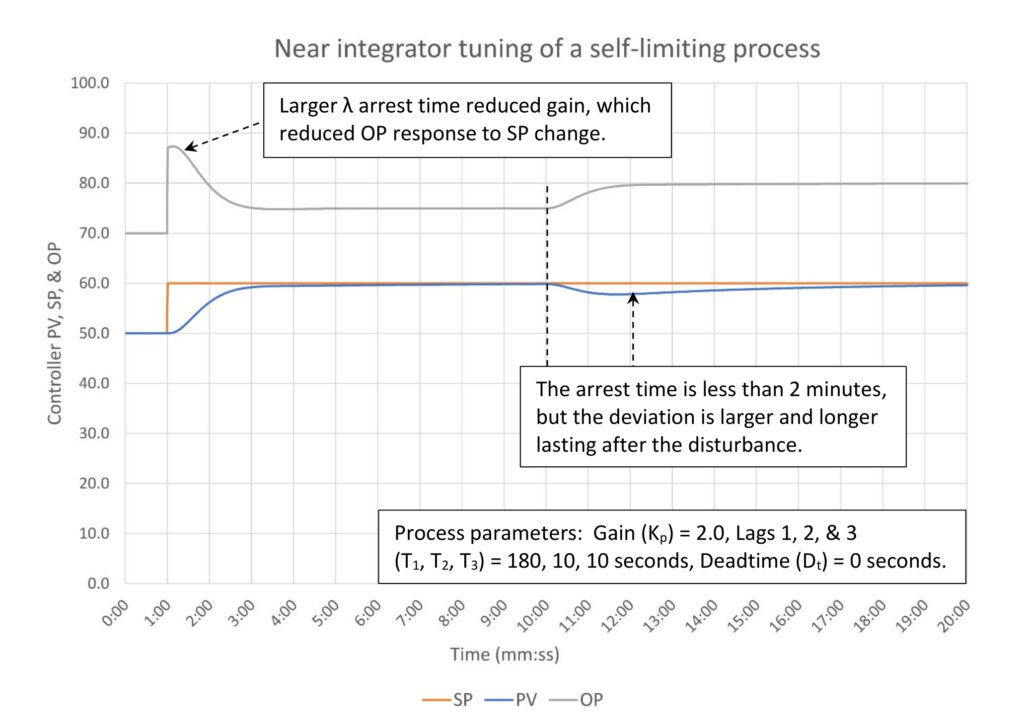
In figure 4 we can see the impact of increasing the value of λ. Based on the tuning constants the controller output has a smaller response to a setpoint change and the deviation from setpoint after a disturbance is larger and longer lasting than we see in figure 2. Putting on our heuristic tuning hat it appears that the integral is too slow. The disturbance is arrested quickly due to controller gain action but lingers waiting for the integral action to eliminate the deviation. We should consider reducing integral to 3.2, about a 25% reduction, as an initial correction.
There are some points to emphasize:
- PID tuning can tolerate a considerable range in the tuning constants, implying that we have wiggle room to trim controller performance to our needs. Mechanistic tuning methods are valuable tools in your loop tuning toolbox, but they only provide guidance, not final answers.
- In the case of lag dominant self-limiting processes there are multiple approaches to get the same result. Here we have “misused” the open loop integrating process loop tuning method to tune a slow self-limiting process because it looks like it might work. As it turns out it does work provided we apply it only to high lag/deadtime ratio processes.
- You have been introduced to one of many loop tuning methods that allow you to select the aggressiveness of the tuning.
Open loop tuning tips for near integrators
Slow control loops should have a flow cascade secondary. The flow secondary will eliminate flow disturbances and will eliminate poor controller performance caused by valve problems. If there isn’t a secondary flow controller, it’s important to check for valve problems before tuning the controller. You won’t have an opportunity to stack the recommended three steps close together because the process, for best results, should be permitted to line out after each step. This eliminates the potential time savings from using the integrating process open loop tuning method.
Open loop tuning limitations
Bad valves will warp the results. Estimated process gain can be wildly inaccurate, especially with small step sizes. Deadtime may also appear variable based on valve response.
How lambda allows for near-integrating processes
Treating a very slow lag dominant self-limiting process like an integrator can reduce tuning time by up to 90%. The tuning method does not identify the steady-state process gain (Kp) or the dominant lag time (T1). Instead, it relies on the fact that the controller gain can be much larger than the baseline controller gain (K >> Kbase) and that a lag-dominant self-limiting process looks very much like an integrating process to a PID controller.
The concept of tuning controller response was introduced using lambda (λ). This adds the ability to tune response to meet the process needs but adds a level of complexity. You now must decide what kind of response is required. If you don’t like it, you can change response by recalculating using a new λ or tweak the constants using heuristic methods. There are multiple paths to the desired result.
Ed Bullerdiek is a retired control engineer with 37 years of process control experience in petroleum refining and oil production. Edited by Mark T. Hoske, editor-in-chief, Control Engineering, WTWH Media, [email protected].
CONSIDER THIS
Can we speed up the tuning of a slow self-limiting process by pretending it is an integrating process? Why does this to work? What are the potential pitfalls? How much time can we save?
Webcast Resources
Aug. 1 RCEP webcast is available for one year: How to automate series: The mechanics of loop tuning
ONLINE
PID series from Ed Bullerdiek, retired control engineer
PID spotlight, part 1: Three reasons to tune control loops: Safety, profit, energy efficiency
PID spotlight, part 2: Know these 13 terms, interactions
PID spotlight, part 3: How to select one of four process responses
PID spotlight, part 4: How to balance PID control for a self-limiting process
PID spotlight, part 5: What does good and bad controller tuning look like?
PID spotlight, part 6: Deadtime? How to boost controller performance anyway
PID spotlight, part 7: Open loop tuning of a self-limiting process
PID spotlight, part 8: Closed loop tuning for self-limiting processes
PID spotlight, part 9: Heuristic tuning for a self-limiting process (part A on heuristic tuning)
PID spotlight, part 10: Heuristic tuning in a self-limiting process
PID spotlight, part 11: How a PID controller works with an integrating process
PID spotlight, part 12: What does good and bad controller tuning look like?
PID spotlight, part 13: Deadtime: what’s the best that I can do?
PID spotlight, part 14: Open loop tuning of an integrating process
More on PID and advanced process control from Control Engineering.
