Lengthy deadtime adversely affects the PID control of an integrating process. Knowing the process fill time/deadtime ratio will tell how well a PID controller will work, or if it will work at all. Can your PID controller be a hero? See “Quick-start PID tuning” and 6 graphs to help.
LEARNING OBJECTIVES
- Learn how the fill time/deadtime ratio tells how well a proportional-integral-derivative (PID) controller can respond to setpoint (SP) changes and reject process disturbances.
- Understand that PID control of a fill time dominant process performs well and offers flexible tuning.
- Know that PID control of a deadtime dominant integrating process is not possible.
- Know the quick start tuning constants for a level controller.
When using proportional-integral-derivative (PID) control for an integrating process, lengthy deadtime can adversely affect control. To tell how well or even if, PID control will work, find and use the process fill-time/deadtime ratio. Also learn from a personal story on PID troubleshooting. In PID spotlight, part 6: we discussed the impact of the lag/deadtime ratio on controller tuning for self-limiting processes. We learned that as the lag/deadtime ratio decreased the controller tuning would become more difficult and controller performance would suffer. In short, excessive deadtime is bad for control. We also learned that for a constant lag/deadtime ratio the controller gain would always be the same whether the lag was 10 seconds and the deadtime 5 seconds (2:1 ratio), or the lag was 10 days and the deadtime five days (still a 2:1 ratio, however the integral time constant would be very different in the two cases.)
Integrating processes have the same dynamic, but with one difference. The important ratio isn’t lag/deadtime, but fill time/deadtime. Fill time is the inverse of the process gain:
Tfill = 1 / Kp
Fill time is analogous to lag time for a self-limiting process in that both describe how fast the process moves to its final value; in the case of an integrating process to 100% or 0%. Similar to self-limiting processes the slower the integrating process moves toward 100/0% the more tolerant the controller tuning is of deadtime. Intuitively, this should make sense; the bigger the vessel, the longer it takes for the level to overflow/run dry and the longer we have to get the level under control.
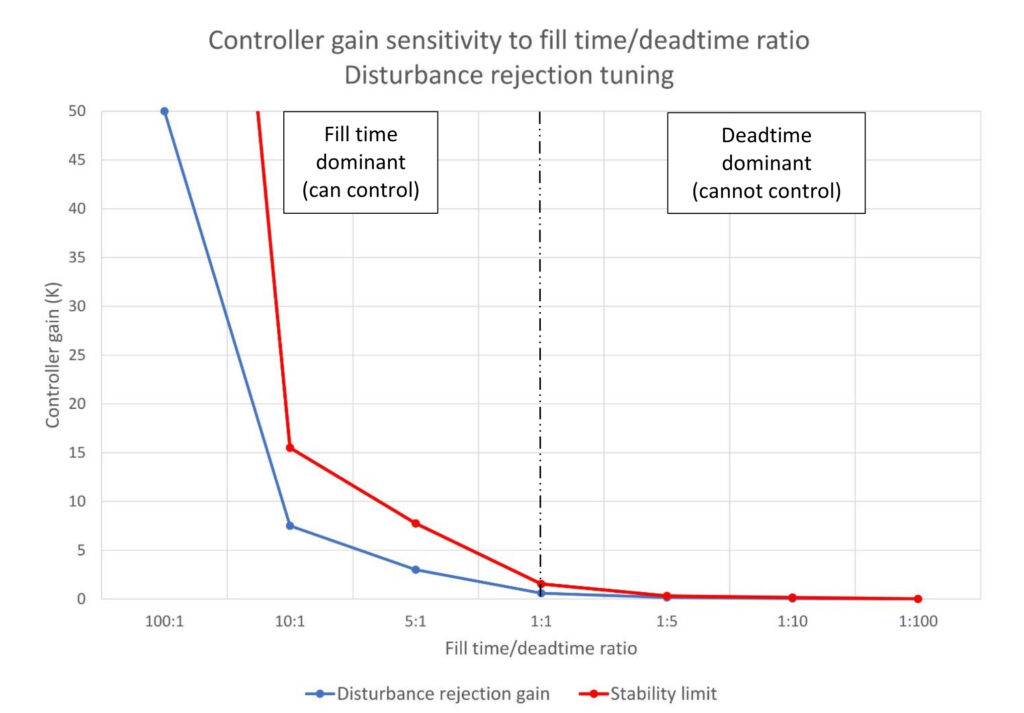
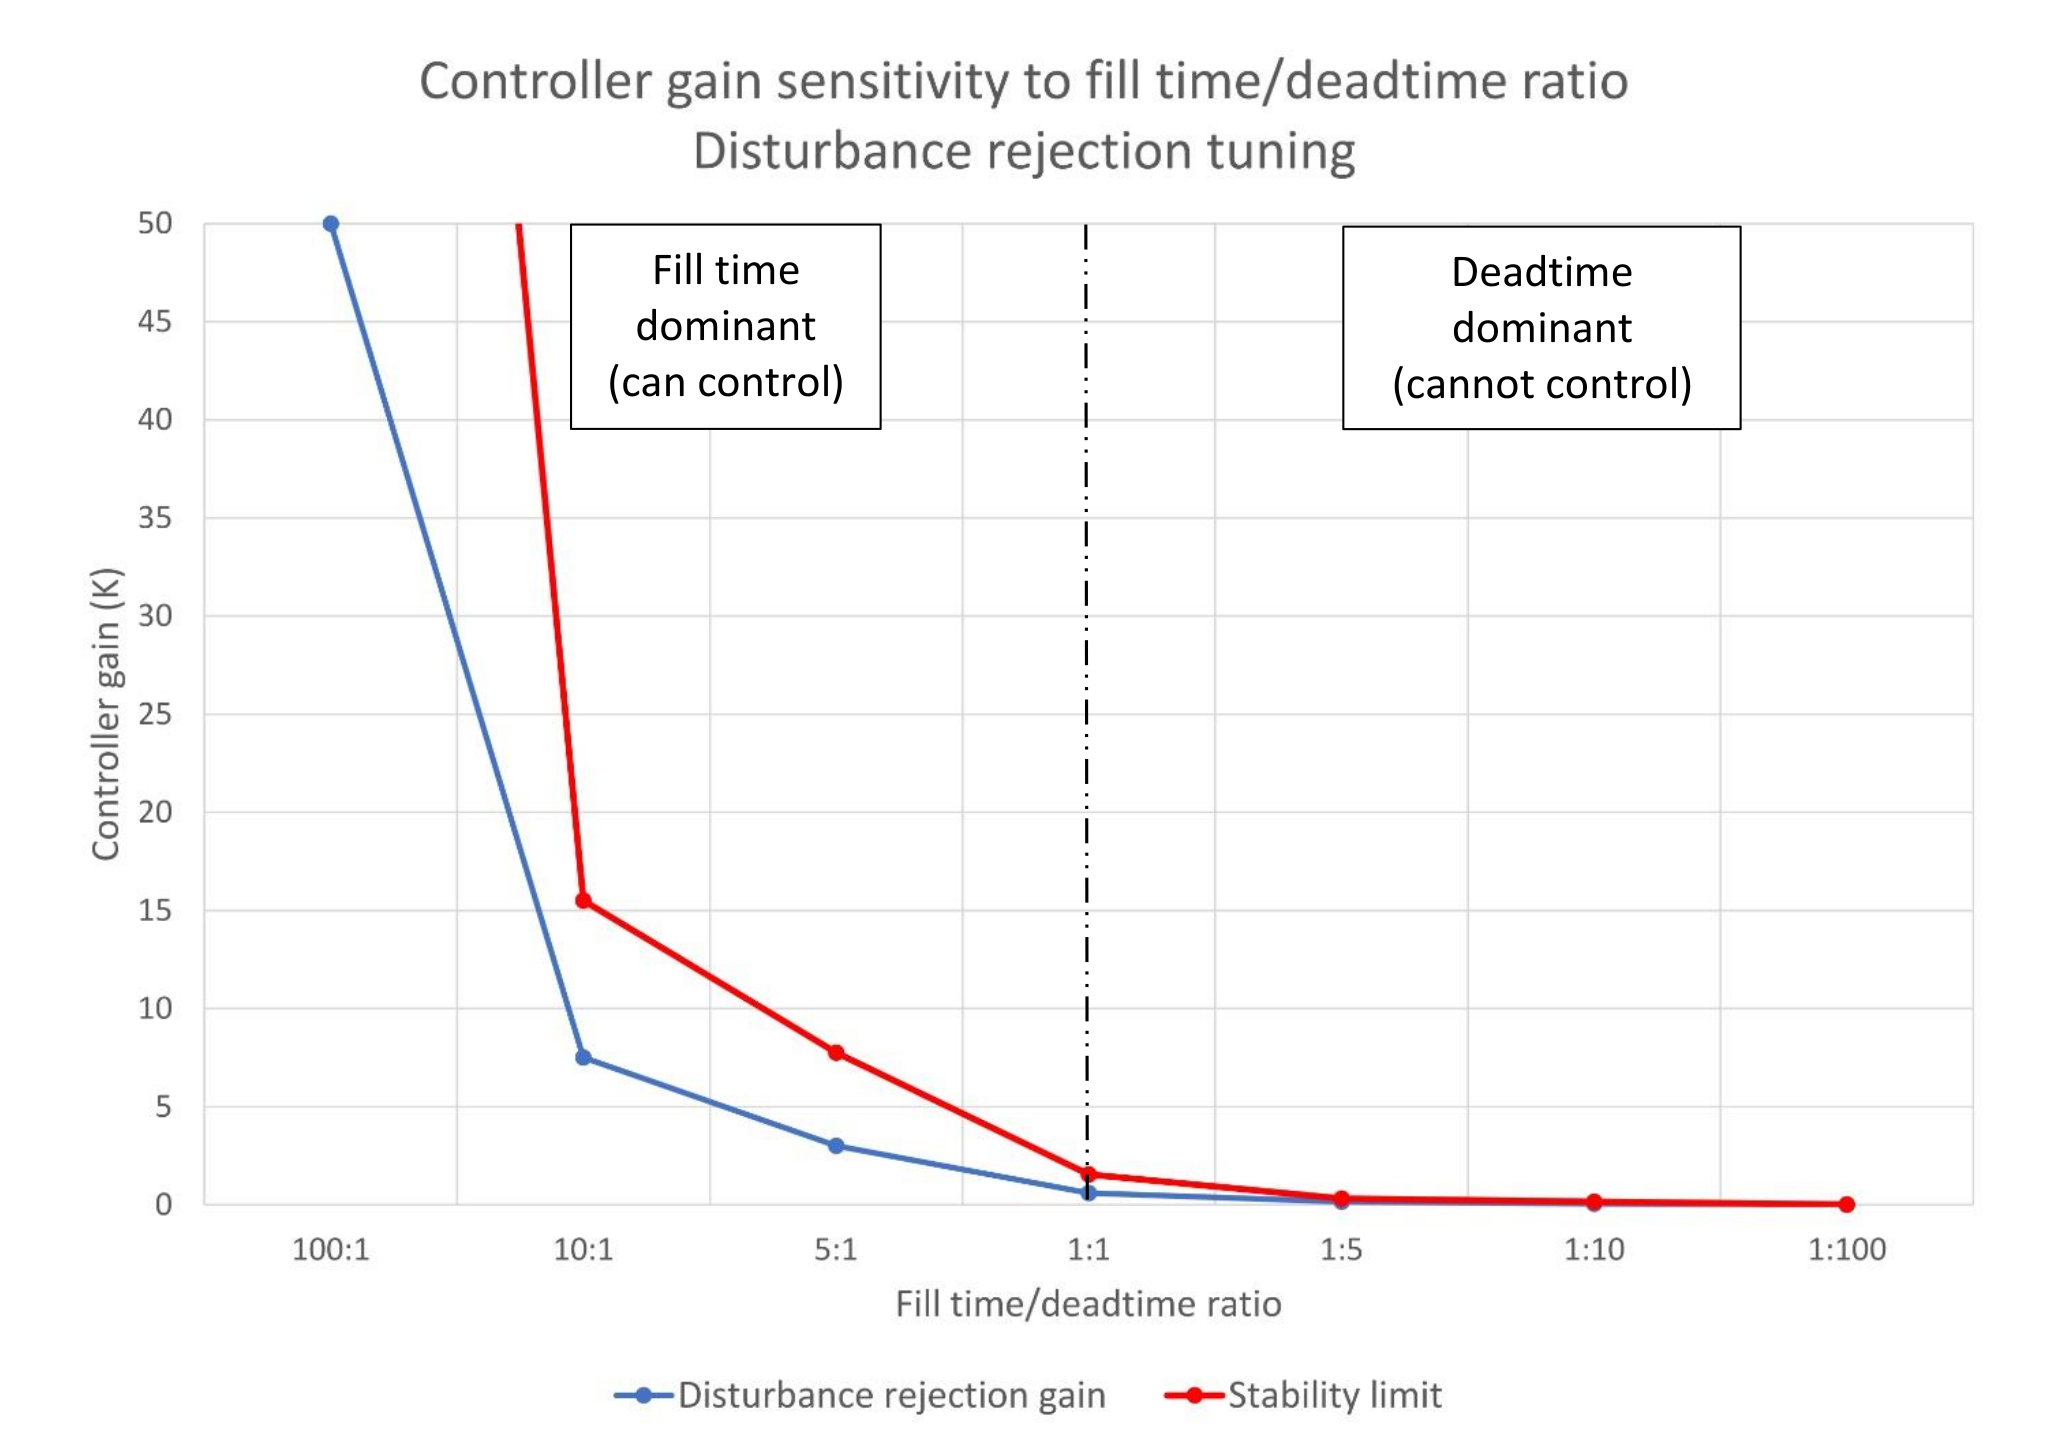
Figure 1 shows that as deadtime comes to dominate the integrating process response the maximum stable controller gain decreases (red line), which limits the effectiveness of a PID controller. Figure 1 also shows that the controller gain (blue line) for disturbance rejection PID tuning decreases proportionally to the stability limit. We saw this in figure 1 in PID spotlight part 6 regarding self-limiting processes.
There is a difference between deadtime dominant self-limiting and integrating processes. Deadtime dominant self-limiting processes can still be controlled – poorly. Integrating processes cannot be effectively controlled once the fill time/deadtime ratio drops below 1:1. Self-limiting processes stop on their own, and the controller can eventually drag the process variable back to setpoint. Integrating processes will simply overflow or run dry. (To reiterate prior advice, if you are on a design team make vessels larger, if at all possible, especially if you expect charge rate growth.)
A closer look at fill time/deadtime ratio in PID control
Controller gain is our primary knob for matching output to input (or input to output) and thus stopping an input (output) disturbance from filling/emptying the vessel. If we can make the controller gain larger, we can better limit the impact of an input change on the level. Figure 1 tells us that if we have a bigger vessel relative to any process deadtime the controller will be easier to tune and provide better control.
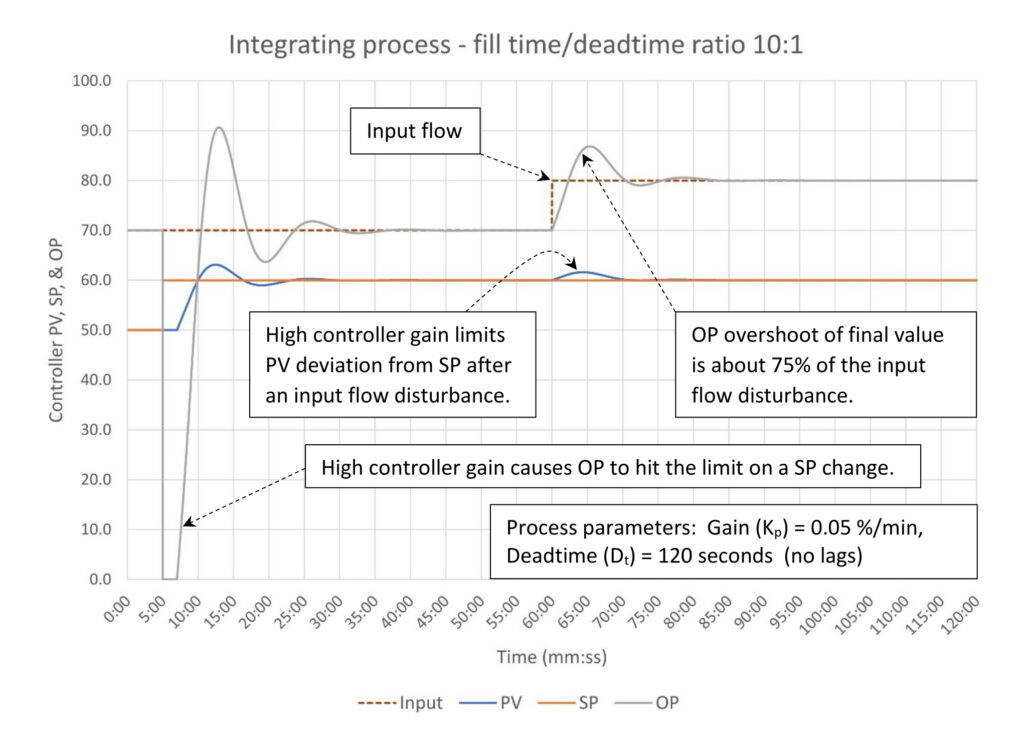
Figure 2 shows the response of an integrating process with a high fill time/deadtime ratio (10:1) that has the PID controller tuned for disturbance rejection. Similar to the lag dominant self-limiting processes we reviewed in PID spotlight part 6, high controller gain:
Limits the process variable (PV) deviation from setpoint (SP) to about 2% despite there being a 10% change in inlet flow.
- The controller output (OP) responds very aggressively to a SP change, hitting the OP limit on a 10% SP change. This could be very disruptive to the downstream process. (If you are tuning for disturbance reduction, then the downstream process, if any, must be able to handle wild input flow changes.) The overall response to the SP change is considerably more oscillatory than the response to a 10% change in input flow.
- The controller is easy to tune since the maximum controller gain (the stability limit) is quite high.
- Note that the controller output (OP) exceeds the input flow disturbance size by about 75%, or in this case a 10% inlet flow disturbance results in a peak output flow that is 17.5% above the initial output flow. We will see that this remains constant through all of the fill time/deadtime ratio cases.
If aggressive output swings are not tolerable when the setpoint is changed, there are several methods that can be used to limit these swings. In PID spotlight part 6, a setpoint (SP) filter was applied to suppress output swings. This is not available on all systems. Figure 3 shows the response when the controller is set up for integral action only on SP changes.
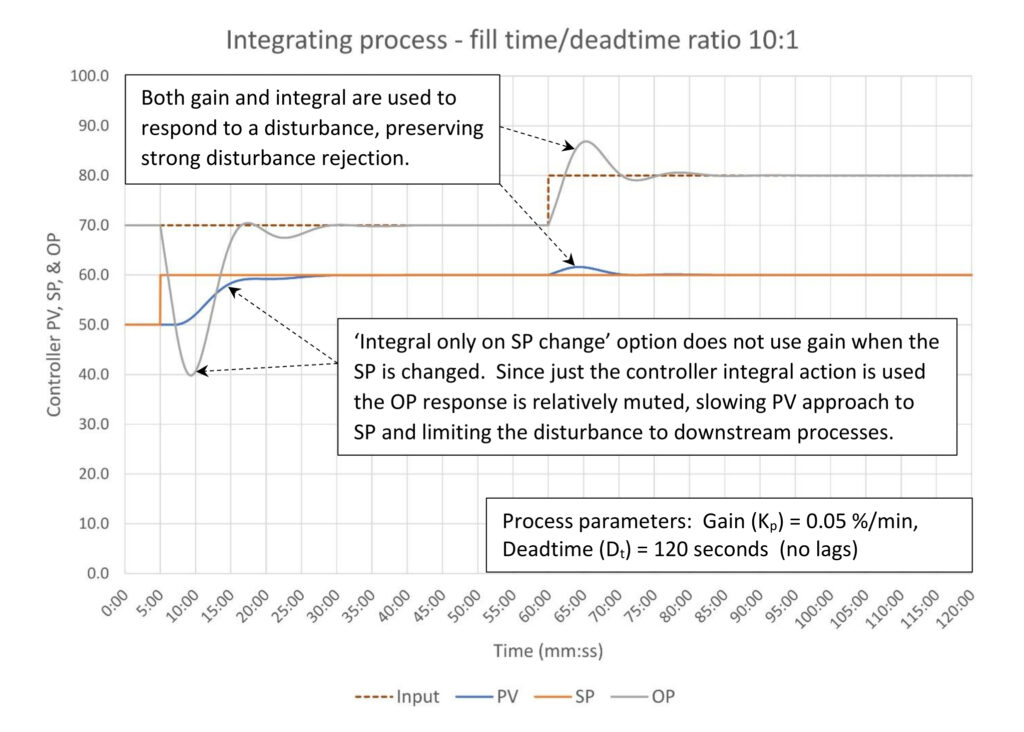
When we compare Figure 3 to Figure 2 we can see that the controller response to the inlet flow disturbance has not changed. We still have a strong response to the change, which limits the PV disturbance to about 2%.
The response to the SP change is considerably muted since the controller gain contribution is removed. Not surprisingly it takes the PV longer to reach SP, and the controller OP response does not hit the low limit and has less oscillation. While we would not expect level controller setpoints to be changed very often you may want to consider setting up the controller to limit output response on a setpoint change to limit the impact on those rare occasions when it is.
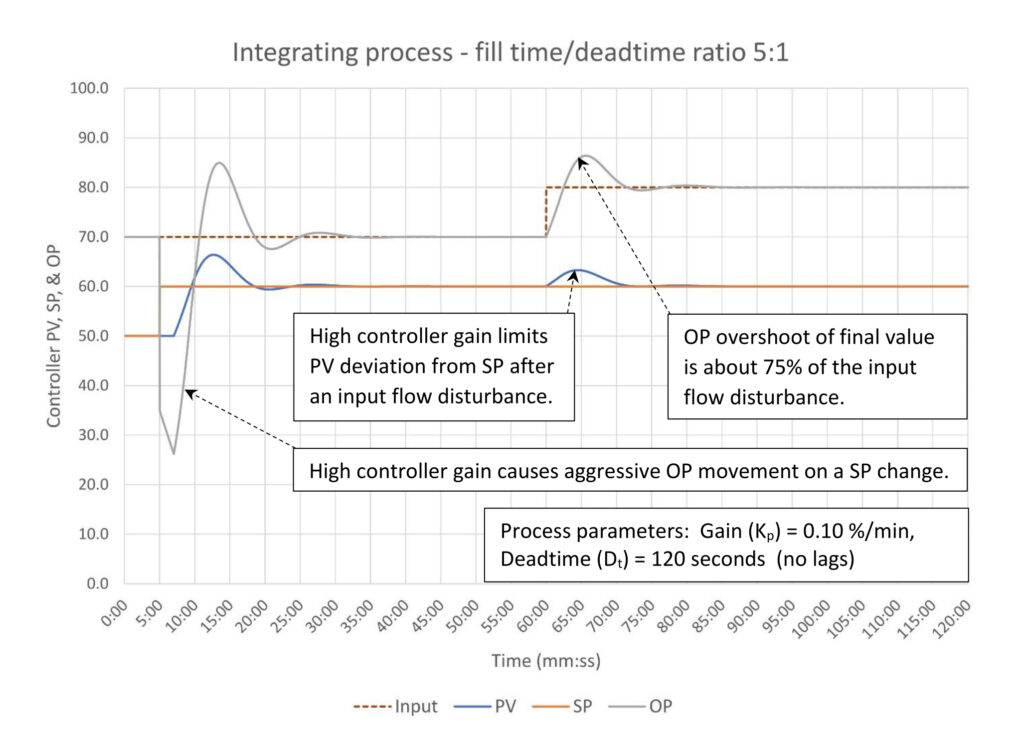
Figure 4 shows the response of an integrating process with a fill time/deadtime ratio of 5:1 that has the PID controller tuned for disturbance rejection. The controller gain, as is typical of disturbance rejection tuning, is set to roughly one-half the controller gain stability limit.
While controller gain has been considerably reduced, we still have:
- Limited PV deviation from SP at about 4% following the 10% change in input flow. Since the controller gain has been cut in half the deviation has doubled from the 10:1 case above.
- The controller output (OP) responds aggressively to a SP change, moving about 43% before the PV starts moving. The overall response to the SP change is considerably more oscillatory than the response to a 10% change in input flow.
- The controller is easy to tune since the maximum controller gain (the stability limit) is still quite high.
Note that the controller integral constant has not changed.
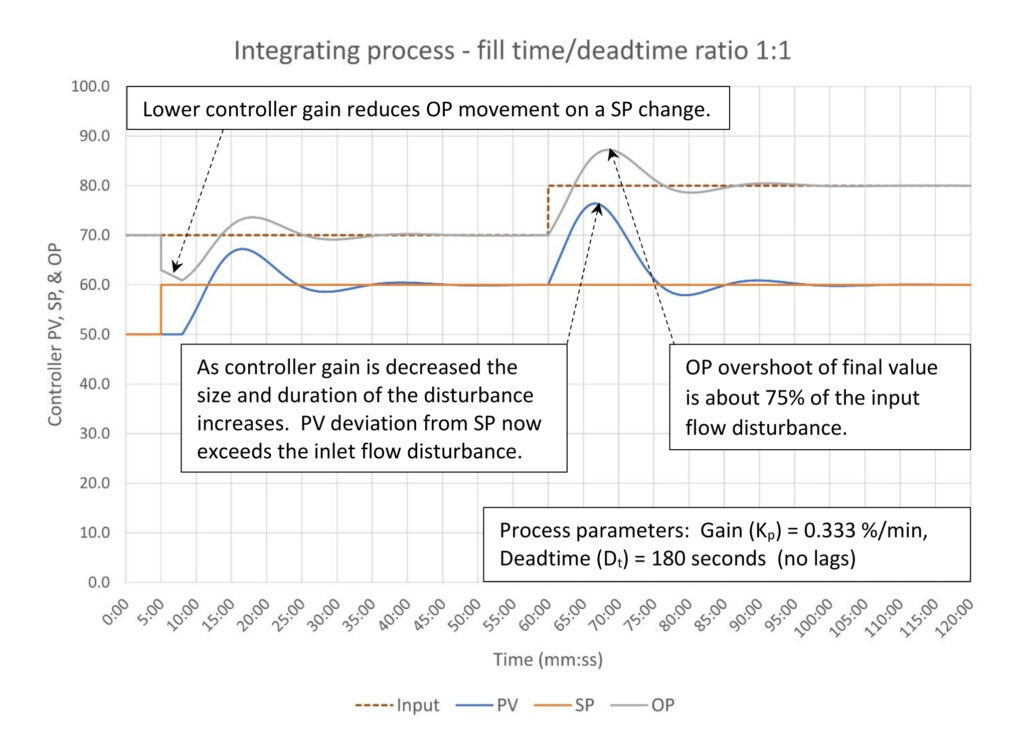
Figure 5 shows the response of an integrating process with a fill time/deadtime ratio of 1:1 that has the PID controller tuned for disturbance rejection. The controller gain at 0.7 is now considerably constrained by the controller gain stability limit of 1.5.
Now that the controller gain has dropped below 1.0:
- PV deviation from SP is about 17% following the 10% change in input flow. The controller will no longer be able to prevent overfill/emptying of the vessel should a large enough disturbance occur. To prevent this feedforward control or other advanced measures may be required.
- As expected because of the lower controller gain the OP has a restrained response to the SP change. The overall response to the SP change is now less oscillatory than the response to a 10% change in input flow as the output overshoot remains 75% of the input flow disturbance.
The constraint on controller gain imposed by the stability limit results in controller tuning that may not meet our needs. We can also see the trade-off between limiting PV deviation from SP versus minimizing OP movement; as controller gain has decreased PV deviation has risen and OP movement has been reduced.
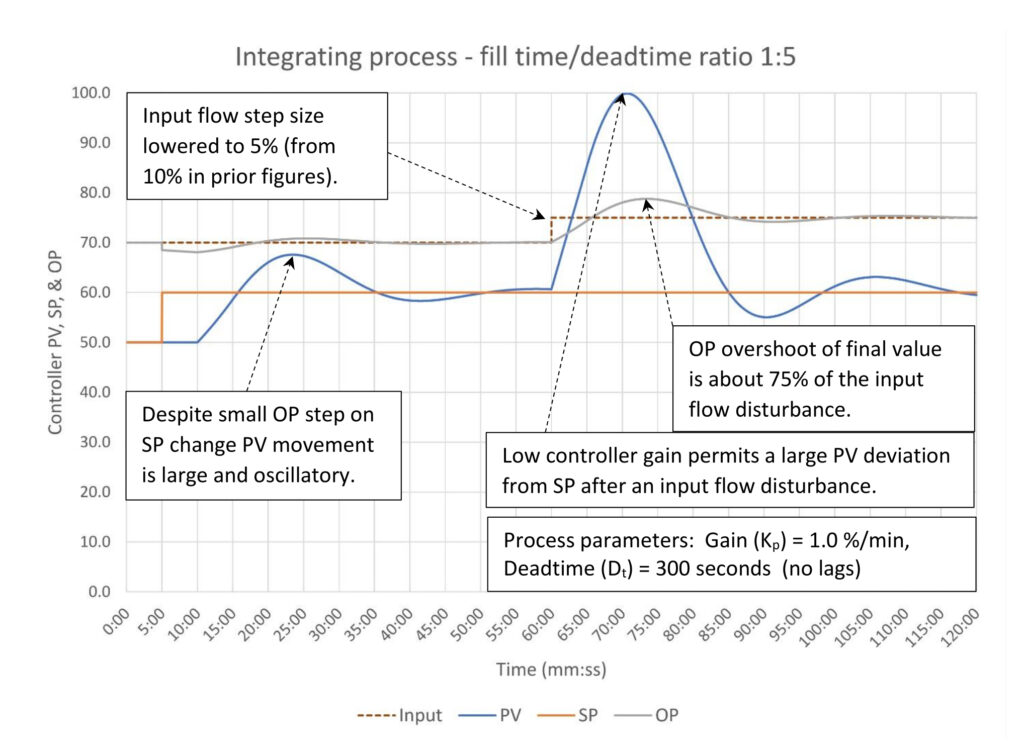
Figure 6 shows the response of a process we hope to never encounter; one where the deadtime exceeds the fill time. In this case, the fill time/deadtime ratio is 1:5. The ratio tells us that when a disturbance occurs, the vessel is very likely to overflow/run dry before the controller can begin to respond due to the deadtime. It was possible to construct a scenario where the controller could keep the PV within the vessel, but only if the disturbance is very small (input flow change of 5%). In this case even a SP change results in significant PV overshoot.
This behavior is a marked contrast from deadtime dominant self-limiting processes. It is still possible to control (poorly) a self-limiting process with considerable deadtime because, well, the process is self-limiting. If uncontrolled, they do not run away like an integrating process will.
Finally, note that the output (OP) overshoot is still 75% above the (now smaller) size of the inlet flow disturbance. Controller output overshoot is a function of the integral constant, not the controller gain. Controller gain primarily sets how far the process variable (PV) will deviate from setpoint (SP) on a disturbance. Integral alone sets how fast the PV returns to SP, but the trade-off for faster return to SP is more OP overshoot. Disturbance rejection tuning involves setting the controller gain as high as possible without oscillation, which is about one-half the controller gain stability limit, and the integral as fast as possible without excess oscillation, which is a function of deadtime and the process gain. This results in the oddity that the controller output response is always the same for disturbance rejection tuning regardless of the controller gain, and thus the process variable’s maximum deviation from setpoint.
A personal story: Troubleshooting an unstable level controller
Shortly before writing this, I was asked by a friend to review a level controller that had unexpectedly gone unstable. This was a high impact, high consequence controller so it received a lot of attention. The trend showed a slow roll, indicating that the controller gain was probably too small. We looked through the trend to find a place where the operator had placed the controller in manual and stepped the output; we were looking for an unintentional open loop step test so we could estimate some rough tuning constants without taking the time to do a formal test.
We found that the process had an astounding three and a half minutes of deadtime. Those of you with experience know that level controllers rarely have significant deadtime. However, we looked at the loop tuning log and found that over the preceding years there was a constant trend of lowering the controller gain. What this told us is that over the years the deadtime had been slowly increasing, adversely affecting controller stability. Control staff had been lowering controller gain without digging deeper into the probable cause.
In this particular case, the probable cause was plugged taps. The level instrument is mounted on a bridle that is attached to the side of the separator vessel. As the taps between the vessel and the bridle plug, the level in the bridle will start to lag the vessel level, and as the plugging progresses this will become deadtime. This preliminary diagnosis was passed to the operations team for resolution, temporary tuning was left in place, and a note was added to the loop tuning log.
More help on PID loop-tuning mechanics
If you haven’t already please consider listening to the Control Engineering webcast, “The mechanics of loop tuning.” This discusses the process of diagnosing issues that can affect controller performance. Loop tuning logs can help you identify nascent issues before they become a big problem (as happened here.) The message is that you are not done when you have completed tuning a controller. If you find that you are constantly revisiting a controller or if the tuning just doesn’t look right (experience helps here), there is probably some kind of problem that cannot be fixed by tuning. You may not be able to identify the problem, but you should pass along the message that there appears to be a bigger problem to someone capable and empowered to do something about it. (Note: There is no implied criticism here. The impact of deadtime is never discussed in a systematic way, therefore it shouldn’t be a surprise that busy practitioners might miss the significance of this trend.)
Summary: The fill-time/deadtime ratio
For integrating processes the fill-time/deadtime ratio gives us important information about how well a PID controller can control that process. If fill time greatly exceeds deadtime (the ratio is high) controller gain can be set quite high without stability problems. If disturbance rejection is required controller gain can be set high enough to sharply limit the impact of a disturbance. However, the use of high controller gain will result in extreme controller output steps when the controller setpoint is changed. If this is not tolerable then some form of setpoint processing will be required.
As the fill time/deadtime ratio falls the maximum stable controller gain falls. As the ratio falls the ability of a PID controller to limit the effect of disturbances declines; process variable maximum deviation to a 10% inlet flow disturbance grows from 2% at a 10:1 ratio to 4% at a 5:1 ratio to 17% at a 1:1 ratio. Estimated process variable deviation would be 80% at a 1:5 ratio; successful PID control would not be possible. From this it appears that a ratio of 1:1 is about the minimum where successful control is still possible. This is unlike self-limiting processes, which by their nature permit PID control (poorly) at lag/deadtime ratios far below 1:1.
Controller gain is not influenced by the fill time or deadtime individually: Only by the ratio. The controller gain will be the same if the fill time is 100 seconds and the deadtime is 10 seconds, or if the fill time is 100 hours and the deadtime is 10 hours. Integral is proportional to the deadtime plus fill time.
Interestingly, disturbance rejection tuning will always result in the controller output overshooting the inlet flow disturbance by 75% regardless of fill time/deadtime ratio.
Quick-start tuning for a level controller
My preferred default tuning for a level controller before startup is:
K = 2.0
Ti = 20 minutes/repeat
This will work reasonably well unless there is an unusually low fill time/deadtime ratio (~2:1) or the process gain is less than 0.02 %/minute (fill time > 50 minutes).
A controller gain of 2.0 guarantees that the controller will be able to keep all but the most extreme disturbances from causing the level to overfill/run dry. Unless there is something very unusual about the process, a process gain less than 0.02 %/minute would not be expected. (A process revamp where a large vessel has been repurposed may very well have an unusually low process gain, but you are unlikely to see this on new construction.)
Once startup is complete you should revisit each controller to reset the tuning to better match the desired response (surge control, disturbance rejection, etc.)
Ed Bullerdiek is a retired control engineer with 37 years of process control experience in petroleum refining and oil production. Edited by Mark T. Hoske, editor-in-chief, Control Engineering, WTWH Media, [email protected].
CONSIDER THIS
Do you know that excessive deadtime can make it impossible to control an integrating process such as a level? Do you understand the trade-offs between disturbance control and excessive controller output movement on a setpoint change?
[MAG]ONLINELink to PID spotlights, parts 1-12 and with this article online, starting with “Three reasons to tune control loops: Safety, profit, energy efficiency.”
Aug. 1 RCEP webcast is available for one year: How to automate series: The mechanics of loop tuning
https://www.controleng.com/webcasts/how-to-automate-the-mechanics-of-loop-tuning
PID series from Ed Bullerdiek, retired control engineer
Part 1: Three reasons to tune control loops: Safety, profit, energy efficiency
PID spotlight, part 2: Know these 13 terms, interactions
PID spotlight, part 3: How to select one of four process responses
PID spotlight, part 4: How to balance PID control for a self-limiting process
PID spotlight, part 5: What does good and bad controller tuning look like?
PID spotlight, part 6: Deadtime? How to boost controller performance anyway
PID spotlight, part 7: Open-loop tuning of a self-limiting process
PID spotlight, part 8: Closed-loop tuning for self-limiting processes
PID spotlight, part 9: Heuristic tuning for a self-limiting process (part A on heuristic tuning)
PID spotlight, part 10: Heuristic tuning in a self-limiting process
PID spotlight, part 11: How a PID controller works with an integrating process
PID spotlight, part 12: What does good and bad controller tuning look like?
Aug. 1 RCEP webcast available for one year: How to automate series: The mechanics of loop tuning
https://www.controleng.com/webcasts/how-to-automate-the-mechanics-of-loop-tuning
More on PID and advanced process control from Control Engineering.
